And more detailed:

We will show below that the meteorological situation was favourable
for an appearence of a geometer/geometeorite.
For more suitable work, below are a couple maps of the region.
And more detailed:
Below are hourly maps of some weather data of July 15, including a cloudiness
( most of the data was taken from the University of Washington www-site ).
The event took place a few minutes after 7 a.m. GMT (=Z), July 15, 2003.
Maps below show general meteorological situation over USA on that day
at:
1 Z
2 Z
3 Z
4 Z
5 Z
6 Z
7 Z
8 Z
9 Z
11 Z
14 Z
17 Z
20 Z
23 Z
An appearence of cloud's cover to the south of the area at about 2 Z is seen, which almost disappeared at about 9 Z.
The situation with the cloudiness with more details is seen on
pictures taken by weather radars.
In Seattle at 7.02 Z:

at 7.31 Z:
and at 8.59 Z:

And in Portland, Oregon at 4.59 Z:
at 5.58 Z:
at 7.02 Z:
at 7.31 Z:
at 8.29 Z:
at 9.33 Z:
and at 10.02 Z:
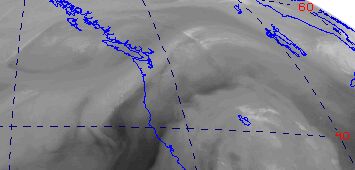
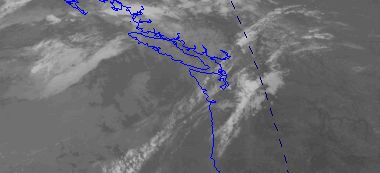
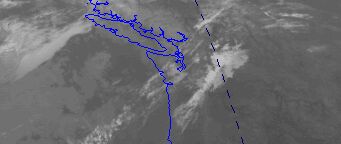
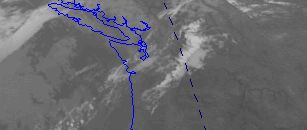
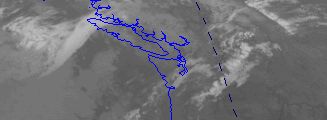
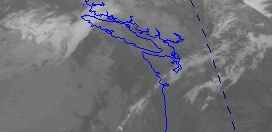
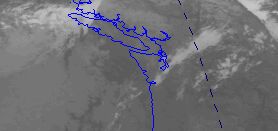
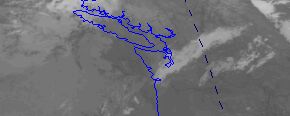
GOES-10 satellite infrared (band 4) pictures also show the cloudiness
cover on July 15 at:
2 Z
3 Z
4 Z
5 Z
6 Z
(or here)
7 Z
8 Z
9 Z
10 Z
12 Z
Also from the pictures it looks like some brighter (i.e. cooler,
i.e. higher) clouds appeared later in the region, but I am not an expert
in this.
Anyway, there was a lot of water vapor in the region as seen from the
"water-vapor" band picture of GOES-10 taken at 8 Z:
Pictures (smoothed and averaged over time period of 6-12 Z) below
present more info on water vapor (relative humidity) at pressure levels:
1000 millibar (near ground)
850 millibar (about 1.5 km altitude)
700 millibar (about 3 km)
500 millibar (about 5.5 km)
300 millibar (about 9 km)
An increase of relative humidity in the region is seen at altitudes
above about a couple kms.
Possibly the increase is related with the jet-stream, as seen in the map
below:
 A profiler in the Seattle area illustrates this:
More detailed (but still smoothed and averaged over time period of
6-12 Z ) pictures show the "from-the-south-to-the-north" component
of a wind at pressure levels:
1000 millibar (near ground)
850 millibar (about 1.5 km altitude)
700 millibar (about 3 km altitude)
1000 millibar (about 5.5 km)
1000 millibar (about 9 km)
100 millibar (about 16 km)
A strong increase in the region of the "from-the-south-to-the-north"
component of the wind above the ground is well-seen.
And now about "from-the-west-to-the-east" component
of the wind at pressure levels:
1000 millibar (near ground)
850 millibar (about 1.5 km altitude)
700 millibar (about 3 km altitude)
500 millibar (about 5.5 km)
300 millibar (about 9 km)
100 millibar (about 16 km)
A strong increase in the region of the "from-the-west-to-the-east"
component of the wind above the ground is well-seen too.
Here you can read meteorological data of that period of time of the
following meteorological stations from the area of the event:
KGRF (47 deg 04' N; 122 deg 34' W);
KPWT (47 deg 30' N; 122 deg 45' W);
KHQM (46 deg 58' N; 123 deg 56' W);
KOLM (46 deg 58' N; 122 deg 54' W);
KSHN (47 deg 14' N; 123 deg 08' W).
The meteo-stations data shows that in the area, periods of "clear-sky",
and "cloudy" swiftlty changed each other.
